The aim of this project was to improve the live solar panel calculator currently used on an MVF advertorial page. I created a prototype based on user research, tested it, and refined it. Unfortunately, I left the company before the product could be launched. Below is a breakdown of my process. Or you can jump to the prototype.
Understanding User Needs
User research on the calculator had already been conducted, so I reviewed and summarised the findings. Key insights included:
- Users needed more detailed information to support their buying decisions. The concept of payback or breakeven time was mentioned but not fully addressed.
- The information provided felt too generic and not personalised enough.
- The calculator lacked interactivity—users couldn’t adjust parameters mid-calculation.
- Overall, users expected more from the tool.

Competitor Analysis
I analysed calculators from two competitor sites, both of which were significantly more detailed than ours. They could:
- Calculate the available space on a user’s roof
- Model energy usage throughout the day based on location
- Adjust for different types of solar panels
Some of these features directly addressed user feedback. For instance, our calculator didn’t factor in location, making the results feel less tailored. Competitor tools also allowed users to adjust parameters easily, improving the experience.


Developing the Formula
I began working on the formula that would define the calculator’s inputs. My goal was to maximise accuracy by:
- Using localised radiation data from the Photovoltaic Geographical Information System (PGIS)
- Asking users to input their yearly household power usage and costs from their last bill
- Offering a selection of three popular solar panels, with an option to manually enter output and efficiency ratings for custom panels
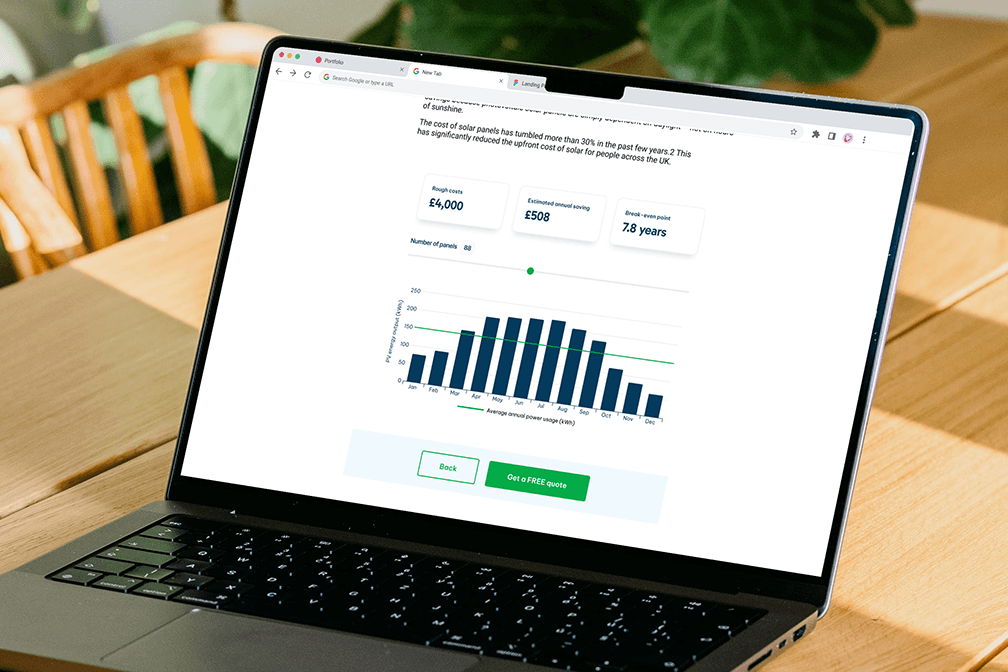
The only assumption was the installation cost. Since we weren’t an installer, I used an average based on research conducted by the Eco Experts team (an MVF brand). With these inputs, the calculator could determine the number of panels needed, installation costs, annual savings, and the break-even point. From there I created a user flow follower by a prototype.

Developing the Formula
I began working on the formula that would define the calculator’s inputs. My goal was to maximise accuracy by:
- Using localised radiation data from the Photovoltaic Geographical Information System (PGIS)
- Asking users to input their yearly household power usage and costs from their last bill
- Offering a selection of three popular solar panels, with an option to manually enter output and efficiency ratings for custom panels
The only assumption was the installation cost. Since we weren’t an installer, I used an average based on research conducted by the Eco Experts team (an MVF brand). With these inputs, the calculator could determine the number of panels needed, installation costs, annual savings, and the break-even point. From there I created a user flow follower by a prototype.


Refining the Approach
Based on feedback from users and colleagues, I simplified the process. Requiring users to enter power usage, costs, and panel types could create a barrier to engagement. Instead, I leveraged available data to make reasonable estimates—similar to how we already estimated installation costs.
Another key improvement was displaying how much power could be sold back to the grid at different times of the year, using PGIS data. While refining the design, I collaborated with a Creative Technologist to assess feasibility and mitigate potential challenges. The key unknowns were postcode integration and using PGIS’s API for radiation levels and annual projections. These concerns were explored in a spike and progressed.

Final prototype
I updated the prototype based on feedback from the wider team and the Creative Technologist before the project moved into development. Shortly after that, I left the company. However, you can view the prototype.